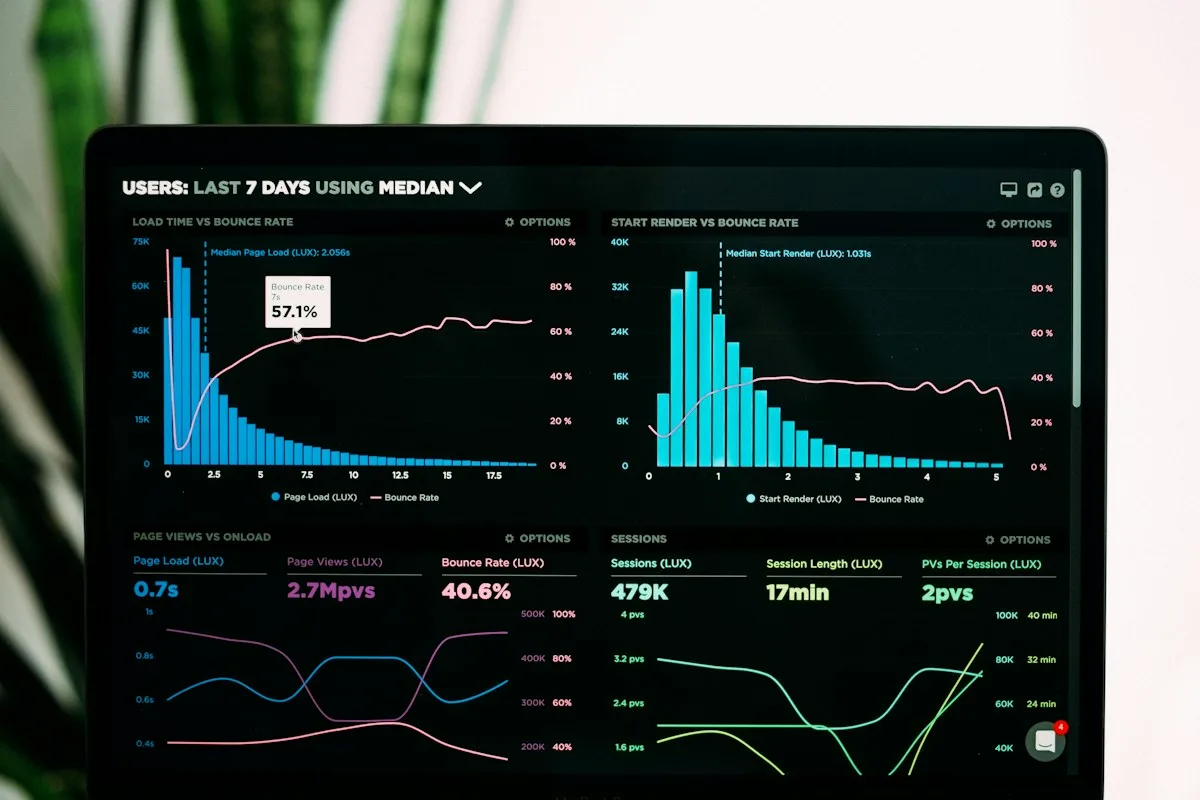

How to read a trend chart without mistaking attention for demand
Check source, baseline, scope and persistence before acting on a rising topic.
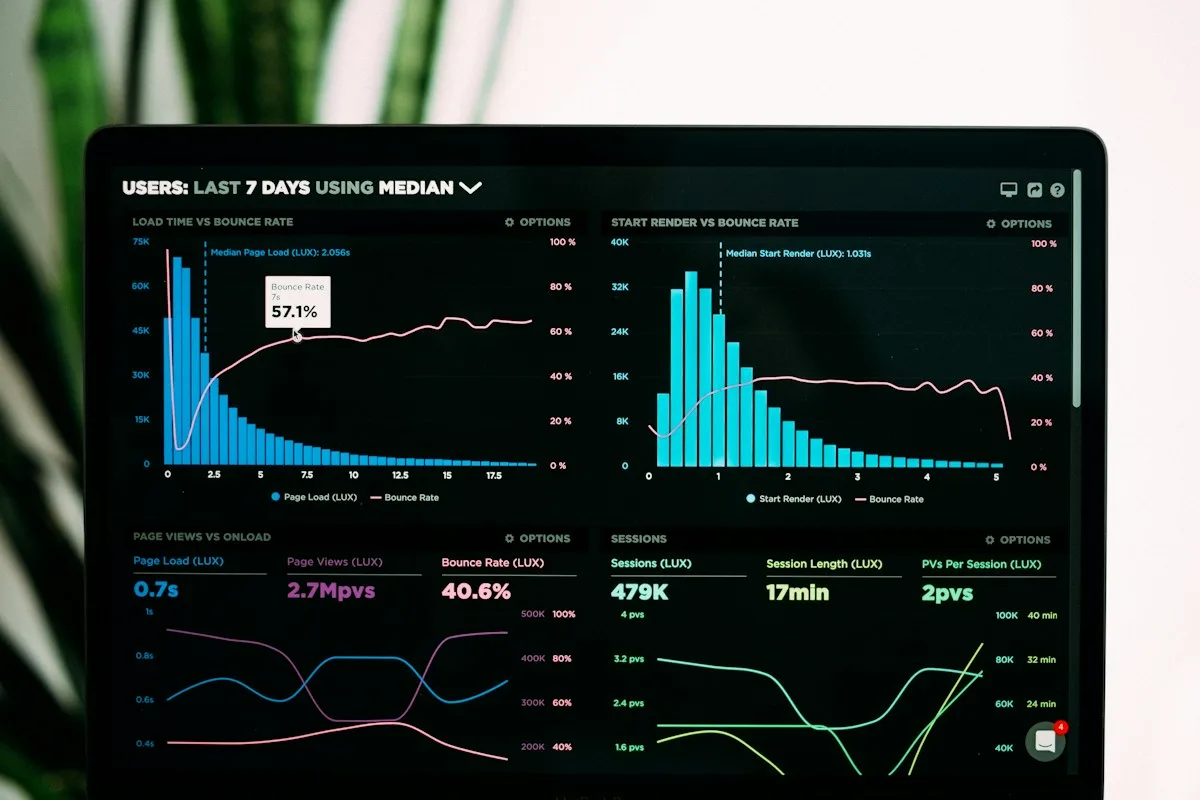
Read each claim against the original evidence. The steps below are educational research methods, not proof that a particular market opportunity exists.
Start with the unit
Before looking at a chart’s shape, identify what its vertical axis measures. Google Trends is a relative index within a request. Wikipedia records pageviews. GitHub star activity describes repository attention, while Reddit describes a bounded sample of posts. These are different observations. A value of 80 cannot be read as eighty customers, and a score of 80 from another source does not mean the same volume. Open the source link and note the geographic scope.
Inspect the baseline
A percentage increase depends on the starting level. A small base can produce an impressive badge while absolute activity remains modest. Check how much history is available and whether the first period is representative. When the baseline is zero, SurgeAtlas labels the result as a new signal rather than calculating an infinite percentage. That invites further research; it does not rank commercial potential. Compare the latest sample with the earlier peak to see whether attention is persisting.
Treat projections as scenarios
The six future points are statistical projections, not observations of future behavior. Dashed lines and shading distinguish them from measured history. Short histories, changing conditions and one-off spikes limit interpretation. Use the direction to frame a question. Do not turn the last point into guaranteed market size or sales. Missing tracker observations are shown separately so a collection gap is not mistaken for zero activity. Read dates as carefully as values.
Write a decision you can test
Choose an audience to interview, a workflow to observe and evidence that would make you reject the idea. Save the source and observation date with your notes. Compare a related trend only when its scope and metric are understood. Look for releases, news and seasonality that could explain movement before assuming new adoption. The useful output is a testable hypothesis with a next action, rather than a large number copied without context. Our niche validation guide turns that hypothesis into an experiment.
Chart inspection field checklist
Before discussing an opportunity, capture these four observations from the original source.
A chart is evidence of the behavior it actually counts. Demand is a separate proposition to investigate.